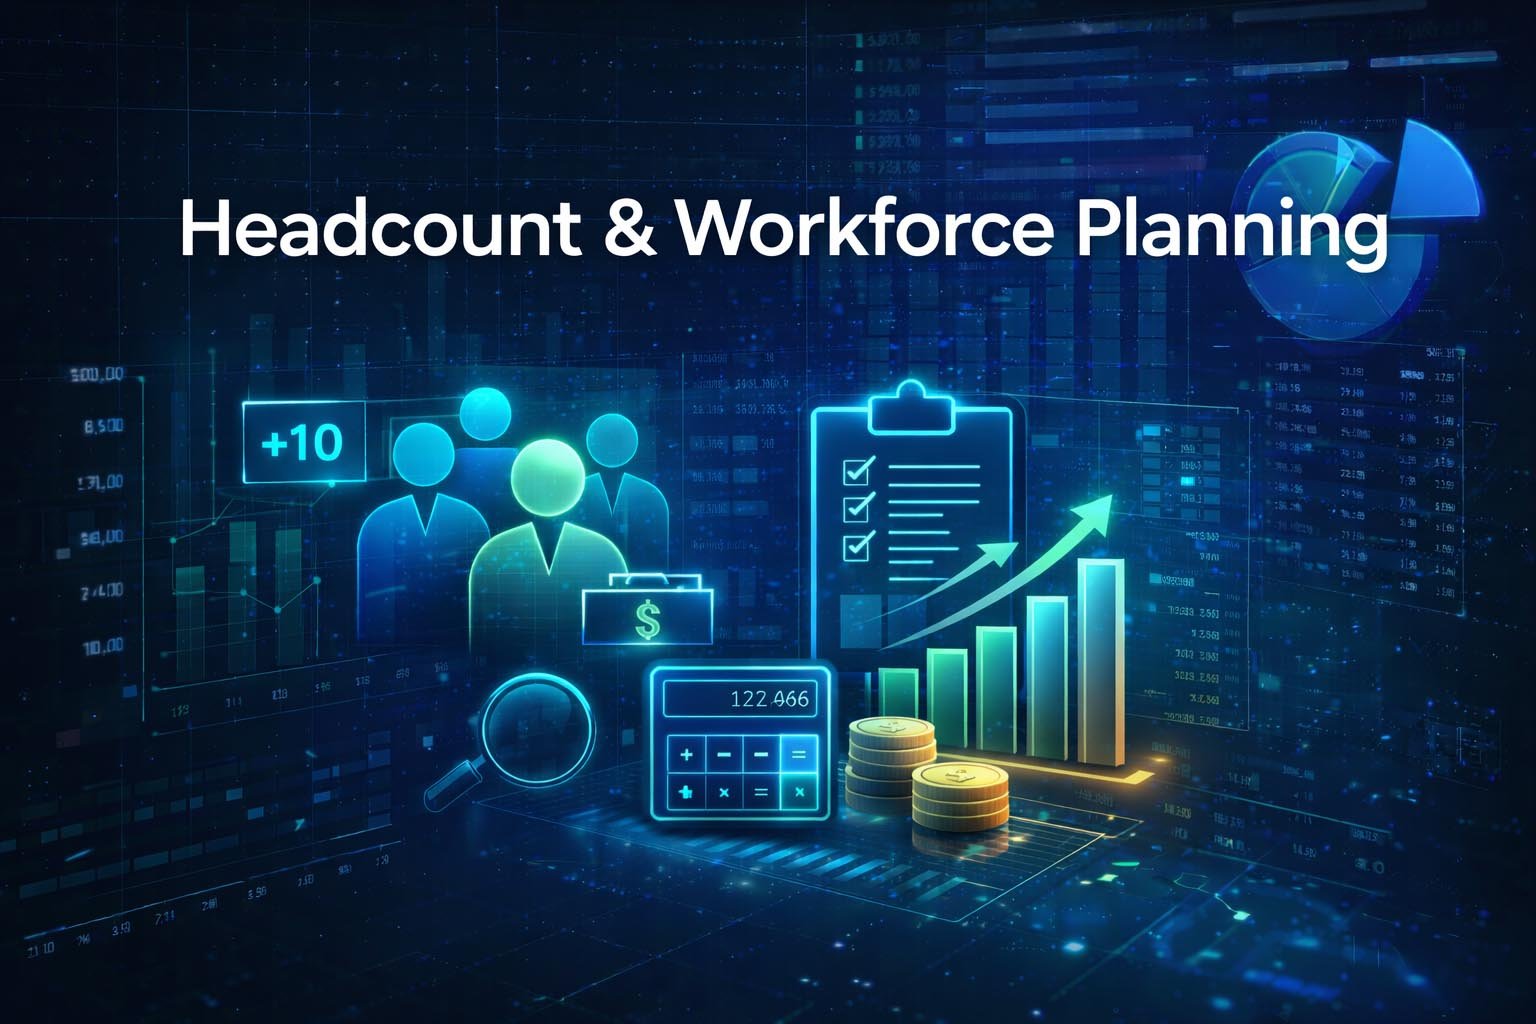
The Case for Workforce Scenario Planning
Single-point forecasts are comfortable. They give leadership one number to plan around and one budget to track against. They are also dangerously fragile. A single missed revenue target, an unexpected acquisition, or a shift in market conditions can render a fixed headcount plan obsolete overnight.
Workforce scenario planning is the practice of building multiple versions of your headcount plan, each tied to a different set of business assumptions. Instead of asking “how many people do we need?” it asks “how many people do we need if revenue grows 20 percent, versus 10 percent, versus flat?” This approach does not eliminate uncertainty, but it compresses the time between recognizing a change and responding to it.
Designing Your Scenario Framework
Choosing the Right Number of Scenarios
Three scenarios is the practical sweet spot for most organizations: a base case, an upside case, and a downside case. Fewer than three and you lose the ability to bracket uncertainty. More than five and the analysis becomes unwieldy, with diminishing returns on each additional scenario.
Some companies add a fourth “stress test” scenario that models a severe downturn, such as a 30 percent revenue shortfall or an immediate hiring freeze. This is particularly valuable for companies in cyclical industries or those with significant venture-backed cash burn.
Defining Scenario Variables
Not every variable needs to change across scenarios. Focus on the two to four assumptions that have the largest impact on headcount requirements. Common scenario drivers include:
- Revenue growth rate. The most common primary driver. Higher revenue generally means more customer-facing and delivery headcount.
- Sales productivity. If reps hit 120 percent of quota versus 80 percent, the number of reps needed to hit the same revenue target changes dramatically.
- Attrition rate. A 5-point increase in voluntary attrition can add dozens of backfill requisitions to the plan.
- Product roadmap scope. A more aggressive roadmap requires more engineering capacity. A scaled-back roadmap may allow redeployment.
- Funding or cash position. For pre-profitability companies, the cash runway directly constrains how aggressively you can hire.
Building the Scenario Matrix
Document each scenario as a named set of assumptions. Be specific and quantitative.
| Assumption | Downside | Base | Upside |
|---|---|---|---|
| Revenue growth | 8% | 15% | 25% |
| Sales quota attainment | 85% | 95% | 105% |
| Voluntary attrition | 18% | 14% | 11% |
| Engineering velocity | 90% of plan | 100% of plan | 100% of plan |
| Time-to-fill (avg days) | 75 | 60 | 50 |
Each combination produces a different headcount requirement. The base case should align with the board-approved operating plan. The upside and downside cases should represent plausible, not extreme, deviations.
Building the Workforce Scenario Model
Step 1: Start with the Base Case Plan
Your base case headcount plan should already exist as part of the annual planning process. It includes new hires by role and start date, expected attrition and backfills, promotions and internal transfers, and contractor-to-employee conversions. This plan becomes the foundation. The other scenarios are expressed as deltas from the base.
Step 2: Create Scenario-Specific Headcount Plans
For each alternative scenario, adjust the headcount plan based on the changed assumptions. In the upside case, you might accelerate 15 hires from Q3 to Q2, add 5 incremental sales reps, and increase the recruiting team by 2 to handle the higher volume. In the downside case, you might defer 10 hires to H2, convert 3 planned full-time roles to contractors, and hold 5 requisitions pending a Q1 revenue checkpoint.
Be specific about which roles change in each scenario. A vague statement like “reduce hiring by 20 percent” is not actionable. Instead, specify which requisitions are deferred, eliminated, or converted.
Step 3: Model the Financial Impact
For each scenario, calculate the total headcount cost by quarter, the incremental cost versus the base case, the impact on operating margin and cash flow, and the revenue-per-employee ratio. Present the financial impact in a side-by-side comparison that makes the trade-offs visible.
Step 4: Identify Trigger Points
This is the most important and most frequently skipped step. For each scenario, define the business metrics that would signal a shift from the base case to that scenario. These triggers should be observable, measurable, and timely.
Examples of trigger points:
- Shift to upside plan: Q1 revenue exceeds plan by more than 10%, pipeline coverage is above 4x for Q2, and voluntary attrition is below 12% trailing 12 months.
- Shift to downside plan: Q1 revenue misses plan by more than 8%, pipeline coverage drops below 2.5x, or cash runway falls below 15 months.
Agreeing on trigger points in advance removes emotion from the decision. When the data says it is time to shift, the playbook is already written.
Step 5: Pre-Approve Response Actions
For each scenario transition, document the specific actions that will be taken and who has authority to execute them. If the downside trigger is hit, does Finance have pre-approval to freeze open requisitions? Does the CEO need to sign off on each deferred hire individually? Clarifying decision rights in advance prevents delays when speed matters most.
Integrating Scenarios into the Operating Rhythm
Monthly Check-In
At each monthly business review, compare actual performance against the scenario trigger points. Update the probability weighting of each scenario based on the latest data. This does not require rebuilding the model each month. It is a 15-minute conversation using a pre-built dashboard.
Quarterly Reforecast
At each quarterly reforecast, refresh the scenario assumptions with current data. The downside case in Q1 may look different than the downside case in Q3 because you have more information and less remaining year to plan for. Adjust the headcount deltas accordingly.
Annual Refresh
During annual planning, rebuild the scenario framework from scratch. Last year’s scenarios are unlikely to be the right ones for next year. The exercise of choosing new scenario variables and setting new trigger points is itself valuable because it forces leadership to articulate what they are most worried about and what would change their plan.
Common Mistakes to Avoid
Building scenarios that are too extreme. If the downside case assumes a 50 percent revenue decline, it will be dismissed as unrealistic and ignored. Scenarios should be plausible enough that leadership takes them seriously.
Failing to assign trigger points. Without triggers, scenarios become an academic exercise. The value is in knowing when to act, not just what to do.
Modeling headcount in isolation from cost. A scenario that says “hire 10 fewer people” without quantifying the dollar and margin impact is incomplete. Always connect headcount to the P&L.
Treating the base case as the only real plan. If leadership psychologically commits to the base case and treats the other scenarios as hypothetical, the planning work is wasted. All scenarios should be presented as equally valid contingency plans.
Workforce scenario planning takes more effort upfront than a single-point forecast. But when conditions change, and they always do, the organization that has already thought through its options will respond faster and more effectively than one that is starting from scratch.